Business Intelligence Dashboard
Enterprise grade employee monitoring solution with integrated Business Intelligence (BI) Features
Teramind’s BI Dashboard Solution
A Business Intelligence Dashboard, or BI Dashboard, is a powerful reporting tool that simplifies visualization and analysis of complex data. With a BI dashboard businesses can track important information including key performance indicators, behavior trends and metrics.
Information in the business intelligence dashboard can be organized by the entire business, divided into departments, or focus on just a few teams. The BI Dashboard is completely customizable so all the behavioral data you’re looking for is always readily available.
Access Critical Information Instantly with a BI Dashboard
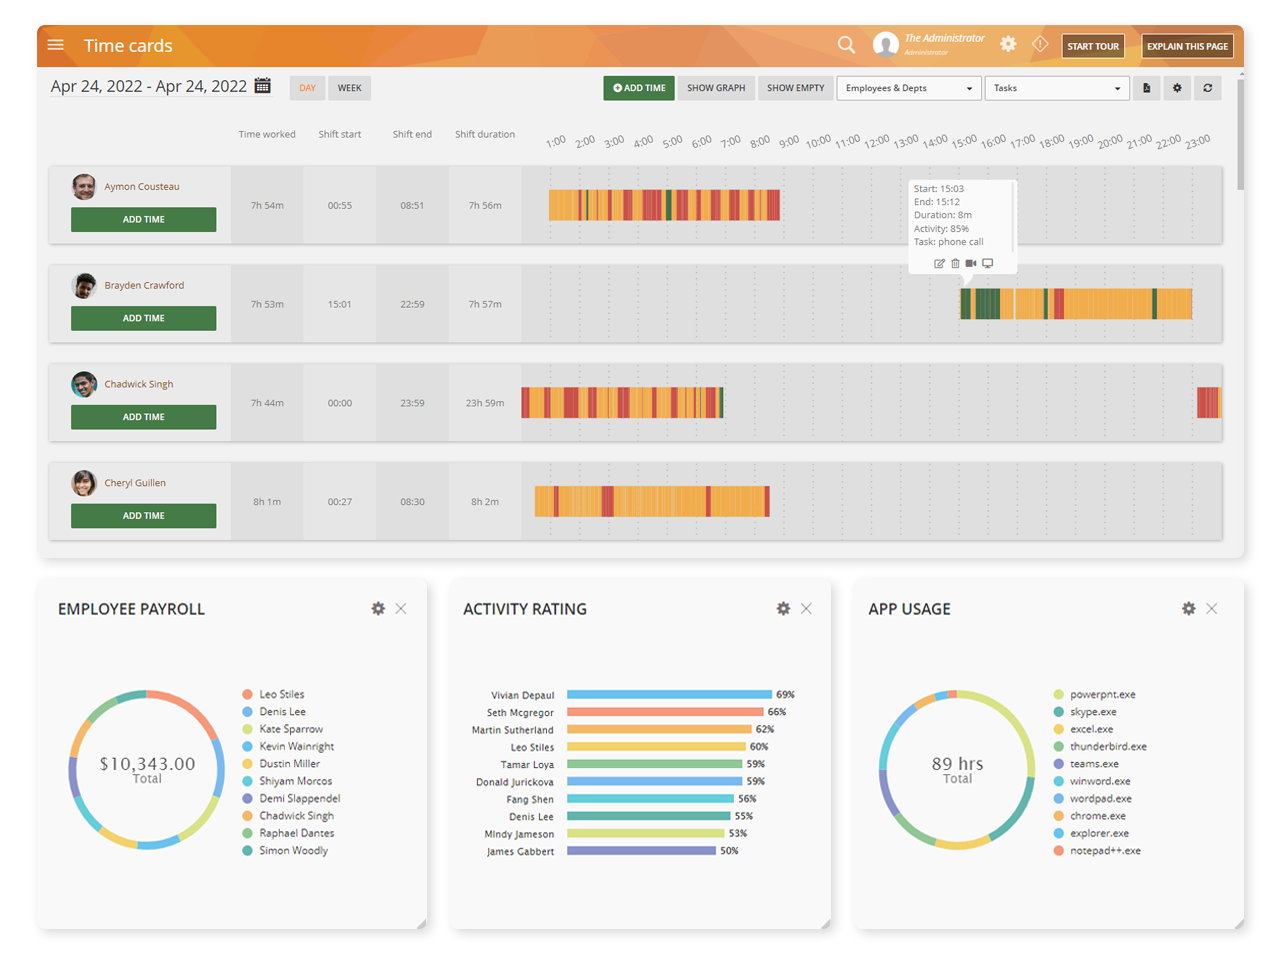
With Teramind BI Dashboard, managers can get timely and quick access to key data
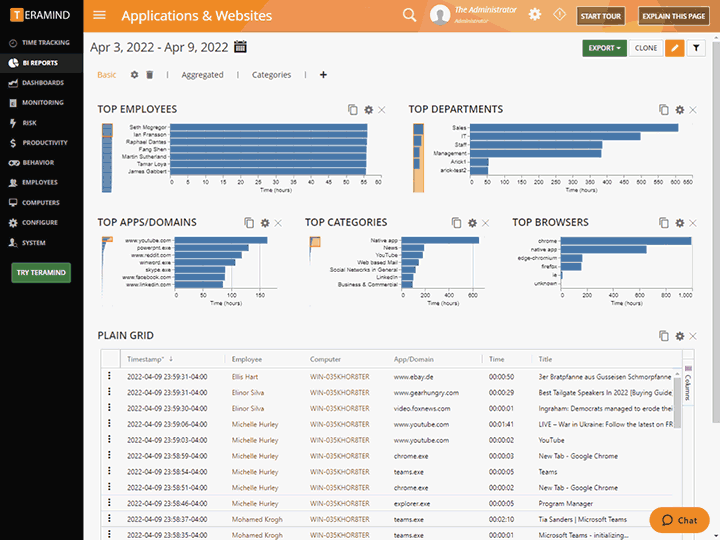
Quick and easy access to user data including app and online activity, task & project engagement and worktime analysis
Immediately view reports or estimated productivity output
View all collected user data from a centralized BI dashboard. Visualize high-level data and drill down for a high-level analysis
Informed Decision Making
Take the guesswork out of the equation. Teramind’s BI Dashboard provides unique insights into your team’s engagement and operational processes
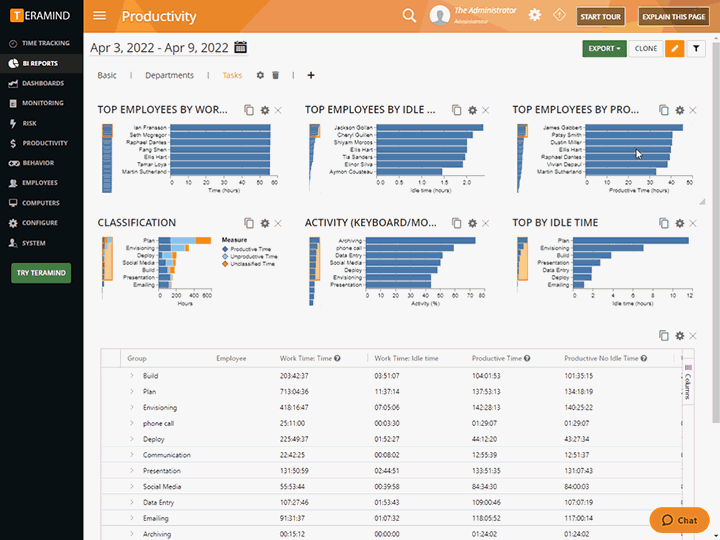
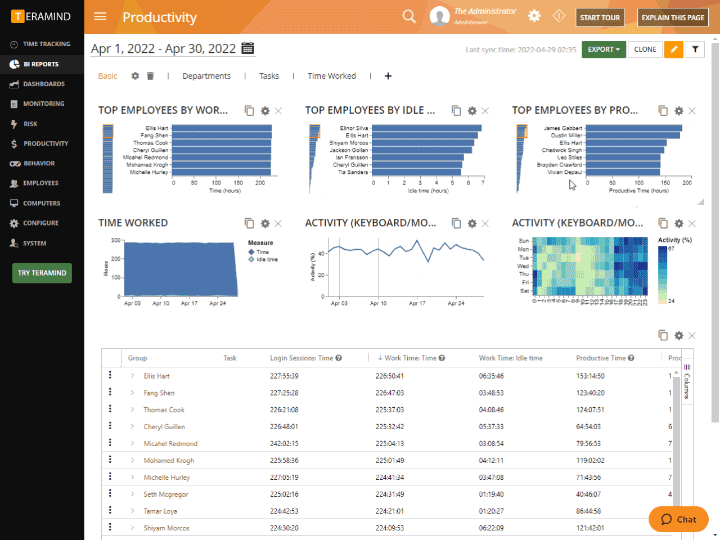
Build intelligent reports outlining departments, teams, individuals or the organization as a whole
Create and keep track of important KPIs, including custom metrics from any user action
Compare scenarios and implement predictive analysis to make data-driven decisions
BI Dashboards Present Complex Data in an Engaging Way
Visualize complex data and analysis with inuitive data presentations
Customize dashboards to present data sets in a way that works for your goals
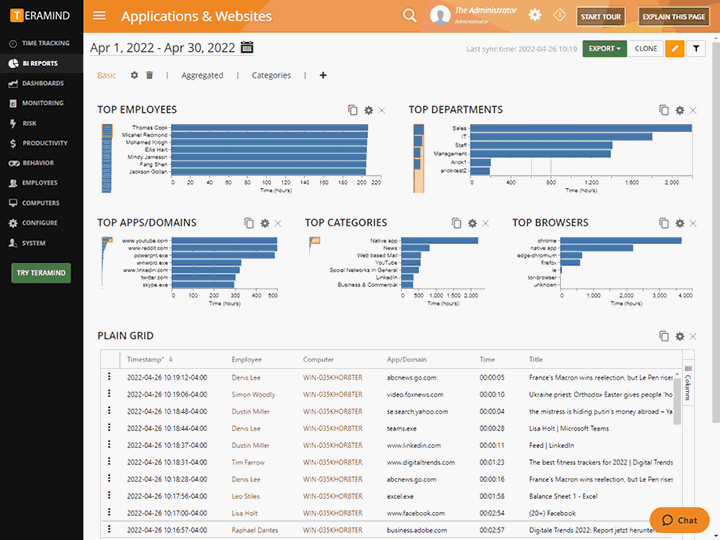
Choose from a variety of display options including bar, area and column charts as well as heat maps and graphs
Use the BI dashboard to quickly create your own reports with easy-to-use widgets and a wide selection of data points
Compare Scenarios and Trends
BI Dashboards are crucial for success in today’s flexible work environment. Create an agile and dynamic workforce by using the business intelligence to compare trends and data movement for continuous workforce optimization
Use customization and configuration settings to view data from a particular period of time, types of actions and more
View detailed comparisons of behavioral data then drill down to see the exact differences in activity
Create an optimized work environment with in-office vs. hybrid vs. remote working comparisons
Restructure teams, departments and projects to improve efficiency using BI Dashboard data comparisons
Measure and Improve Team Productivity
Lift teams using the behavioral data Teramind collects. Teramind BI Dashboard provides insights that inform employee engagement and burnout, project mismanagement, and workflow bottlenecks
Use app and website use metrics to identify ways to increase employee efficiency
Harness employee time tracking, task completion and other activity metrics to reduce time wasted
Get time-sensitive information summarized in BI dashboards in order to investigate anomalies
Guide employees’ focus and improve engagement using information from Teramind’s powerful BI dashboard
The Features That Power Teramind
Teramind Business Intelligence Dashboard Features
A
BI Dashboard with
Multi-Level Reporting
Summary views, smart lookups, and drill-down screens for granular data analysis make reporting accessible to all levels of the management team
Integrated Employee Monitoring, DLP and BI Dashboard Capabilities
Bundled with Teramind’s award-winning employee monitoring and DLP solutions, the BI Dashboard allows business leaders to align their enterprise goals with employee productivity, security, and compliance
Pre-Built
Report
Templates
Dozens of predefined report templates for employee activity, productivity, worktime, tasks, performance, alerts, security, reputation, risks, etc
A Powerful
Report Builder
Highly configurable report builder with intuitive, visual tools. Create comparative reports with multi-dimensional data points such as employees vs. departments, tasks vs. app categories, periods, etc. Simplify report generation with auto ranking, filters, and built-in formulas
Extensive Filtering Capabilities
Narrow down large datasets with powerful filtering capabilities. Filter reports by periods, employees, departments, computers, tasks, LDAP attributes and more. Each report also comes with its own context-specific filters. For example, filter emails by destination, alerts by severity, etc. Save and reuse common filters for easy reporting
Custom
KPI Widgets
Create custom widgets from any data the power BI dashboard captures, such as app/web activity, emails, console commands, login, printing file events, etc. Present the information in grids, charts or heatmaps for easy visualization
Collaboration
Create report clones in the dashboard software with a single click and share among team members and departments. Set permission for view and edit controls
Data Export and API
Export your BI reports in PDF and CSV format or schedule them for auto-delivery to email addresses. View reports in other applications or export data using the built-in API
Visualized data that elevates your business
The Business Intelligence Dashboards informs data security, workforce management and much more
Employee monitoring tools can provide crucial information about employee activity. However, they often lack key features of a business intelligence dashboard. Including the ability to transform the ‘behavioral’ data into actionable intelligence.
As a result, enterprises have to rely on expensive solutions that require complex integration. Most businesses end up relying on multiple products such as employee monitoring and other analytics tools to get the much-needed business insight.
The right dashboard software can simplify this solution along with reporting.
Through the BI Dashboard, IT managers and security analysts can view powerful insights and actionable behavior analytics that reveal the risky and vulnerable actions and activities performed by users.
The visual data presented in the dashboards assists security professionals in understanding the human elements of insider threats and data leaks; and, helps to develop customized mitigation plans that respond to the staff’s distinct behaviors.
Teramind integrated business intelligence software equips leaders with the metrics needed to make data-driven decisions and manage teams efficiently.
Enterprise teams benefit from the data in
Empowers enterprise teams to be more focused, decisive, and productive.
Help HR leaders introduce policies and techniques for cultural improvements based on comprehensive analysis of employee behaviors.
Flexible Deployment
Deploy Teramind in a way that works for your organization
Cloud
Get up and running in minutes with Teramind cloud deployment. Automatic updates with no licenses or hardware

We bring businesses peace of mind through our award-winning insider threat prevention solution


Ready to get started?
Improve productivity and data security with the
global leader in behavior analytics.